










Inventory Reports Every Ecommerce Operator Should Run (And How to Automate Them)
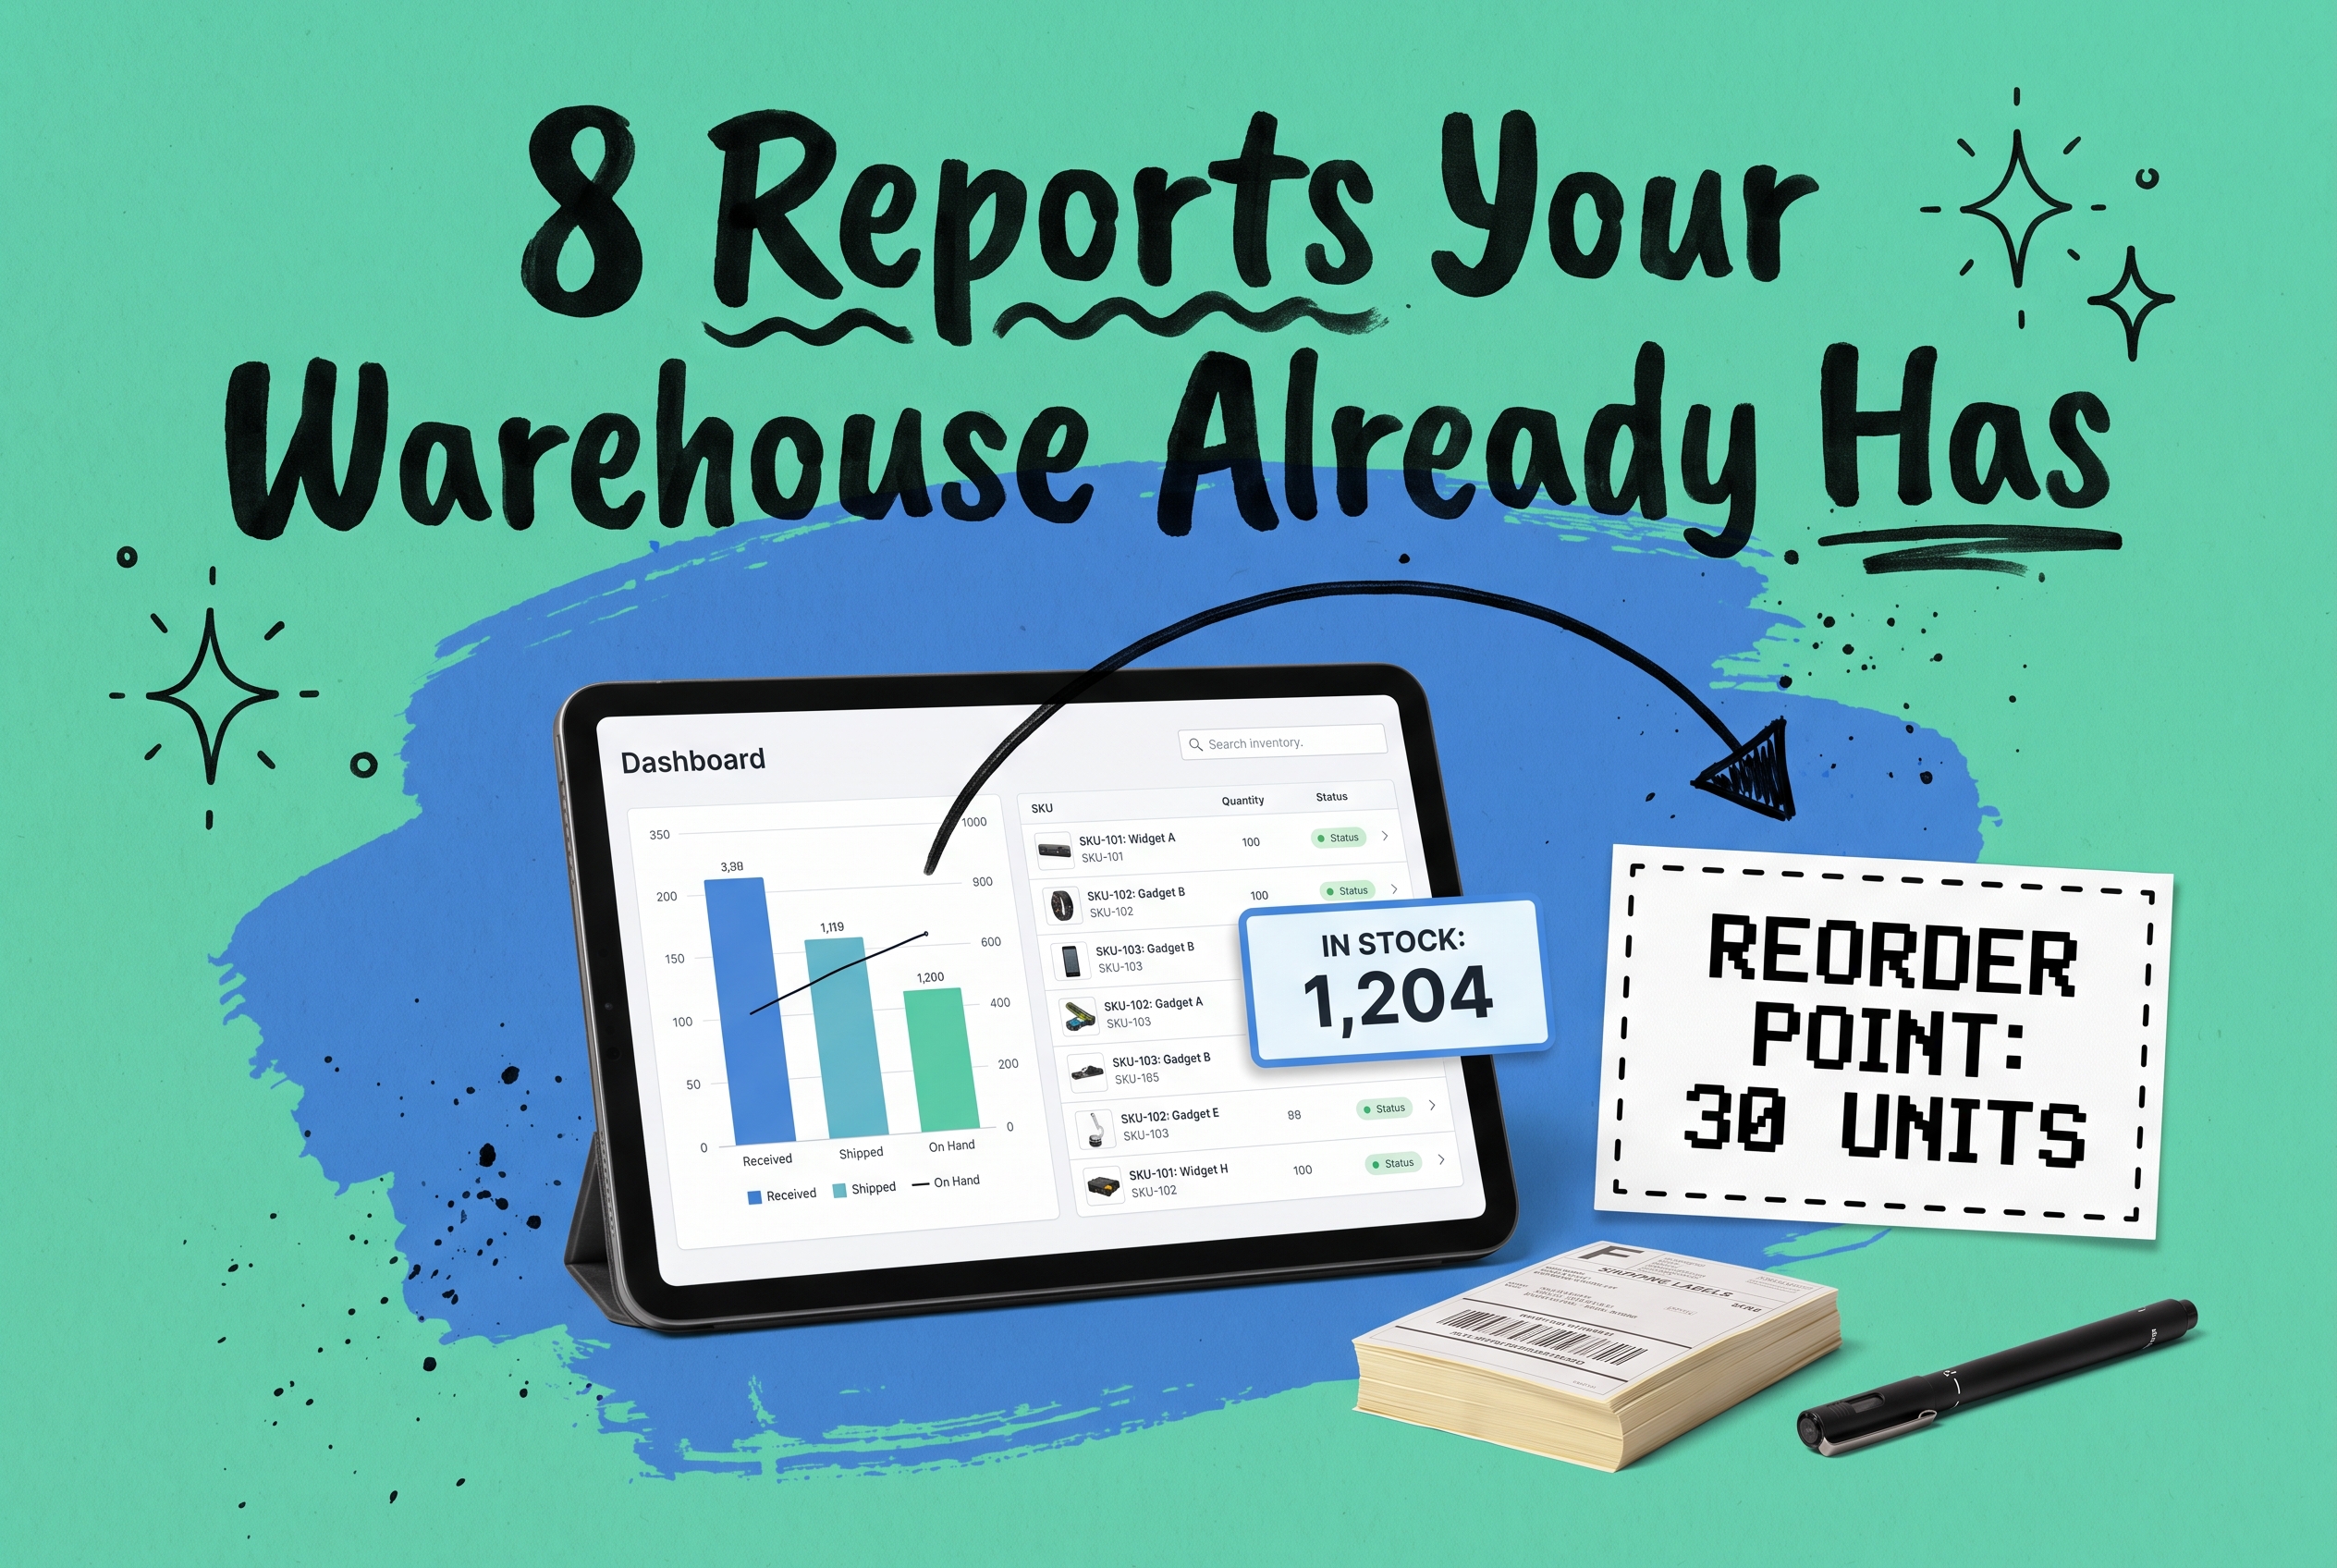
Inventory reporting is the practice of generating structured data snapshots from your stock system so you can make purchasing, fulfillment, and sales decisions on accurate numbers rather than guesswork. A useful inventory report answers four questions: what do you have, where is it, what's it worth, and what's moving?
For a multi-channel ecommerce brand, that clarity is table stakes. Without it, you're making reorder calls based on a figure someone typed into a spreadsheet two weeks ago. Stock outs, overbuying, and write-offs follow directly from that kind of data lag. The eight reports below cover the decisions that matter most and how to set them up without a data analyst on the payroll.
What a Good Inventory Report Actually Does
The word "report" implies something you print and file. Inventory reports are more useful as operational triggers.
A current stock report triggers a purchase order. A dead stock report triggers a clearance pricing call. A sell-through report triggers a channel allocation shift. Each one converts raw stock data into a question you can answer with a yes or a number.
Getting there requires clean, real-time data from every channel you sell on. If your Shopify store and your Amazon account update inventory on different schedules, your reports are already wrong before you open them.
The 8 Inventory Reports Every Ecommerce Operator Needs
1. Current Stock Snapshot Report
What it shows: Total units on hand for every SKU across every location, right now.
The decision it drives: Do I have enough stock to fulfill today's orders, and from which locations?
This is the foundational report. You need it accurate before any other report means anything. For a brand selling TSHIRT-BLU-M on Shopify, Amazon, and its own 3PL, a current stock report tells you whether the 47 units you think you have are actually 47 or whether 12 of them are already allocated to open orders.
OmniOrders keeps this number live across all channels, so the figure in your inventory management platform reflects actual available inventory, not a stale CSV export.
2. Inventory Valuation Report
What it shows: The total cost value of stock on hand, broken down by SKU, category, or location.
The decision it drives: How much capital is sitting in inventory, and where?
This one is useful for financial reporting, cash flow planning, and identifying categories where you're carrying too much relative to sales velocity. If you're holding $180,000 in seasonal SKUs heading into Q1, the valuation report surfaces that before your accountant does at month-end.
3. Low Stock and Reorder Report
What it shows: SKUs that have fallen below a defined threshold or reorder point.
The decision it drives: What needs ordering, and how urgently?
This report only works if your reorder points are current. A static threshold of 50 units for a SKU that sells 200 units a week in peak season is a stock out waiting to happen. OmniOrders' AI-powered forecasting adjusts reorder points based on sales velocity and lead time so you're not operating off a number set during onboarding and never touched since.
4. Sell-Through Rate Report
What it shows: The percentage of received inventory sold over a given period.
The decision it drives: Which SKUs are performing, and which ones need intervention?
Sell-through rate = (units sold / (units sold + units on hand)) x 100. A SKU at 20% sell-through after eight weeks is underperforming. A SKU at 90% in that same window needs a reorder immediately or it will stock out before the next shipment arrives. Pair this report with your ecommerce inventory KPI tracking to build a full picture of product health.
5. Dead Stock and Slow-Moving Inventory Report
What it shows: SKUs that haven't moved in a defined window, typically 90 or 180 days depending on your category.
The decision it drives: What do I liquidate, discount, bundle, or write off?
Dead stock has carrying costs. If your 3PL charges monthly storage fees by pallet position, holding 200 units of a discontinued colorway for six months is not free. This report surfaces exactly those SKUs before the storage bill shows up as a line-item surprise.
6. Inventory Aging Report
What it shows: How long current stock has been sitting, broken into age brackets (0-30 days, 31-60, 61-90, 90+).
The decision it drives: Is stock aging in a way that creates spoilage or obsolescence risk?
For apparel and consumer electronics, aging inventory is fashion risk or spec risk. A 90-day aging report for a laptop accessories brand means some of those units are now competing with the next hardware generation. Catching that early gives you time to discount rather than write off.
7. Stock Movement Report
What it shows: All inventory transactions over a period: receipts, shipments, adjustments, and transfers.
The decision it drives: Where did my inventory actually go, and does the math add up?
This is the audit trail. If your system shows 300 units received and 250 shipped but only 30 on hand, a stock movement report shows you where the other 20 went. It's also the first report to pull when a customer says an item was out of stock during a period where your snapshot said you had plenty.
8. Multi-Location Inventory Report
What it shows: Stock levels broken down by warehouse, 3PL node, or retail location.
The decision it drives: Should I rebalance stock between locations to cut shipping costs or improve delivery speed?
If 80% of your Northeast customer orders are being fulfilled from a California warehouse while your New Jersey 3PL sits at 15% capacity, that's a carrier rate problem hiding inside a fulfillment problem. A multi-location report makes it visible. OmniOrders' multi-warehouse inventory management gives you this view across all nodes in a single dashboard, so rebalancing decisions are based on actual per-location stock rather than aggregated totals.
What Spreadsheet Reporting Actually Costs You
The classic workflow: someone downloads a CSV from Shopify, pulls another from Amazon Seller Central, pastes them into a master spreadsheet, and reconciles the numbers. It takes two to three hours. The data is out of date by the time the spreadsheet is open.
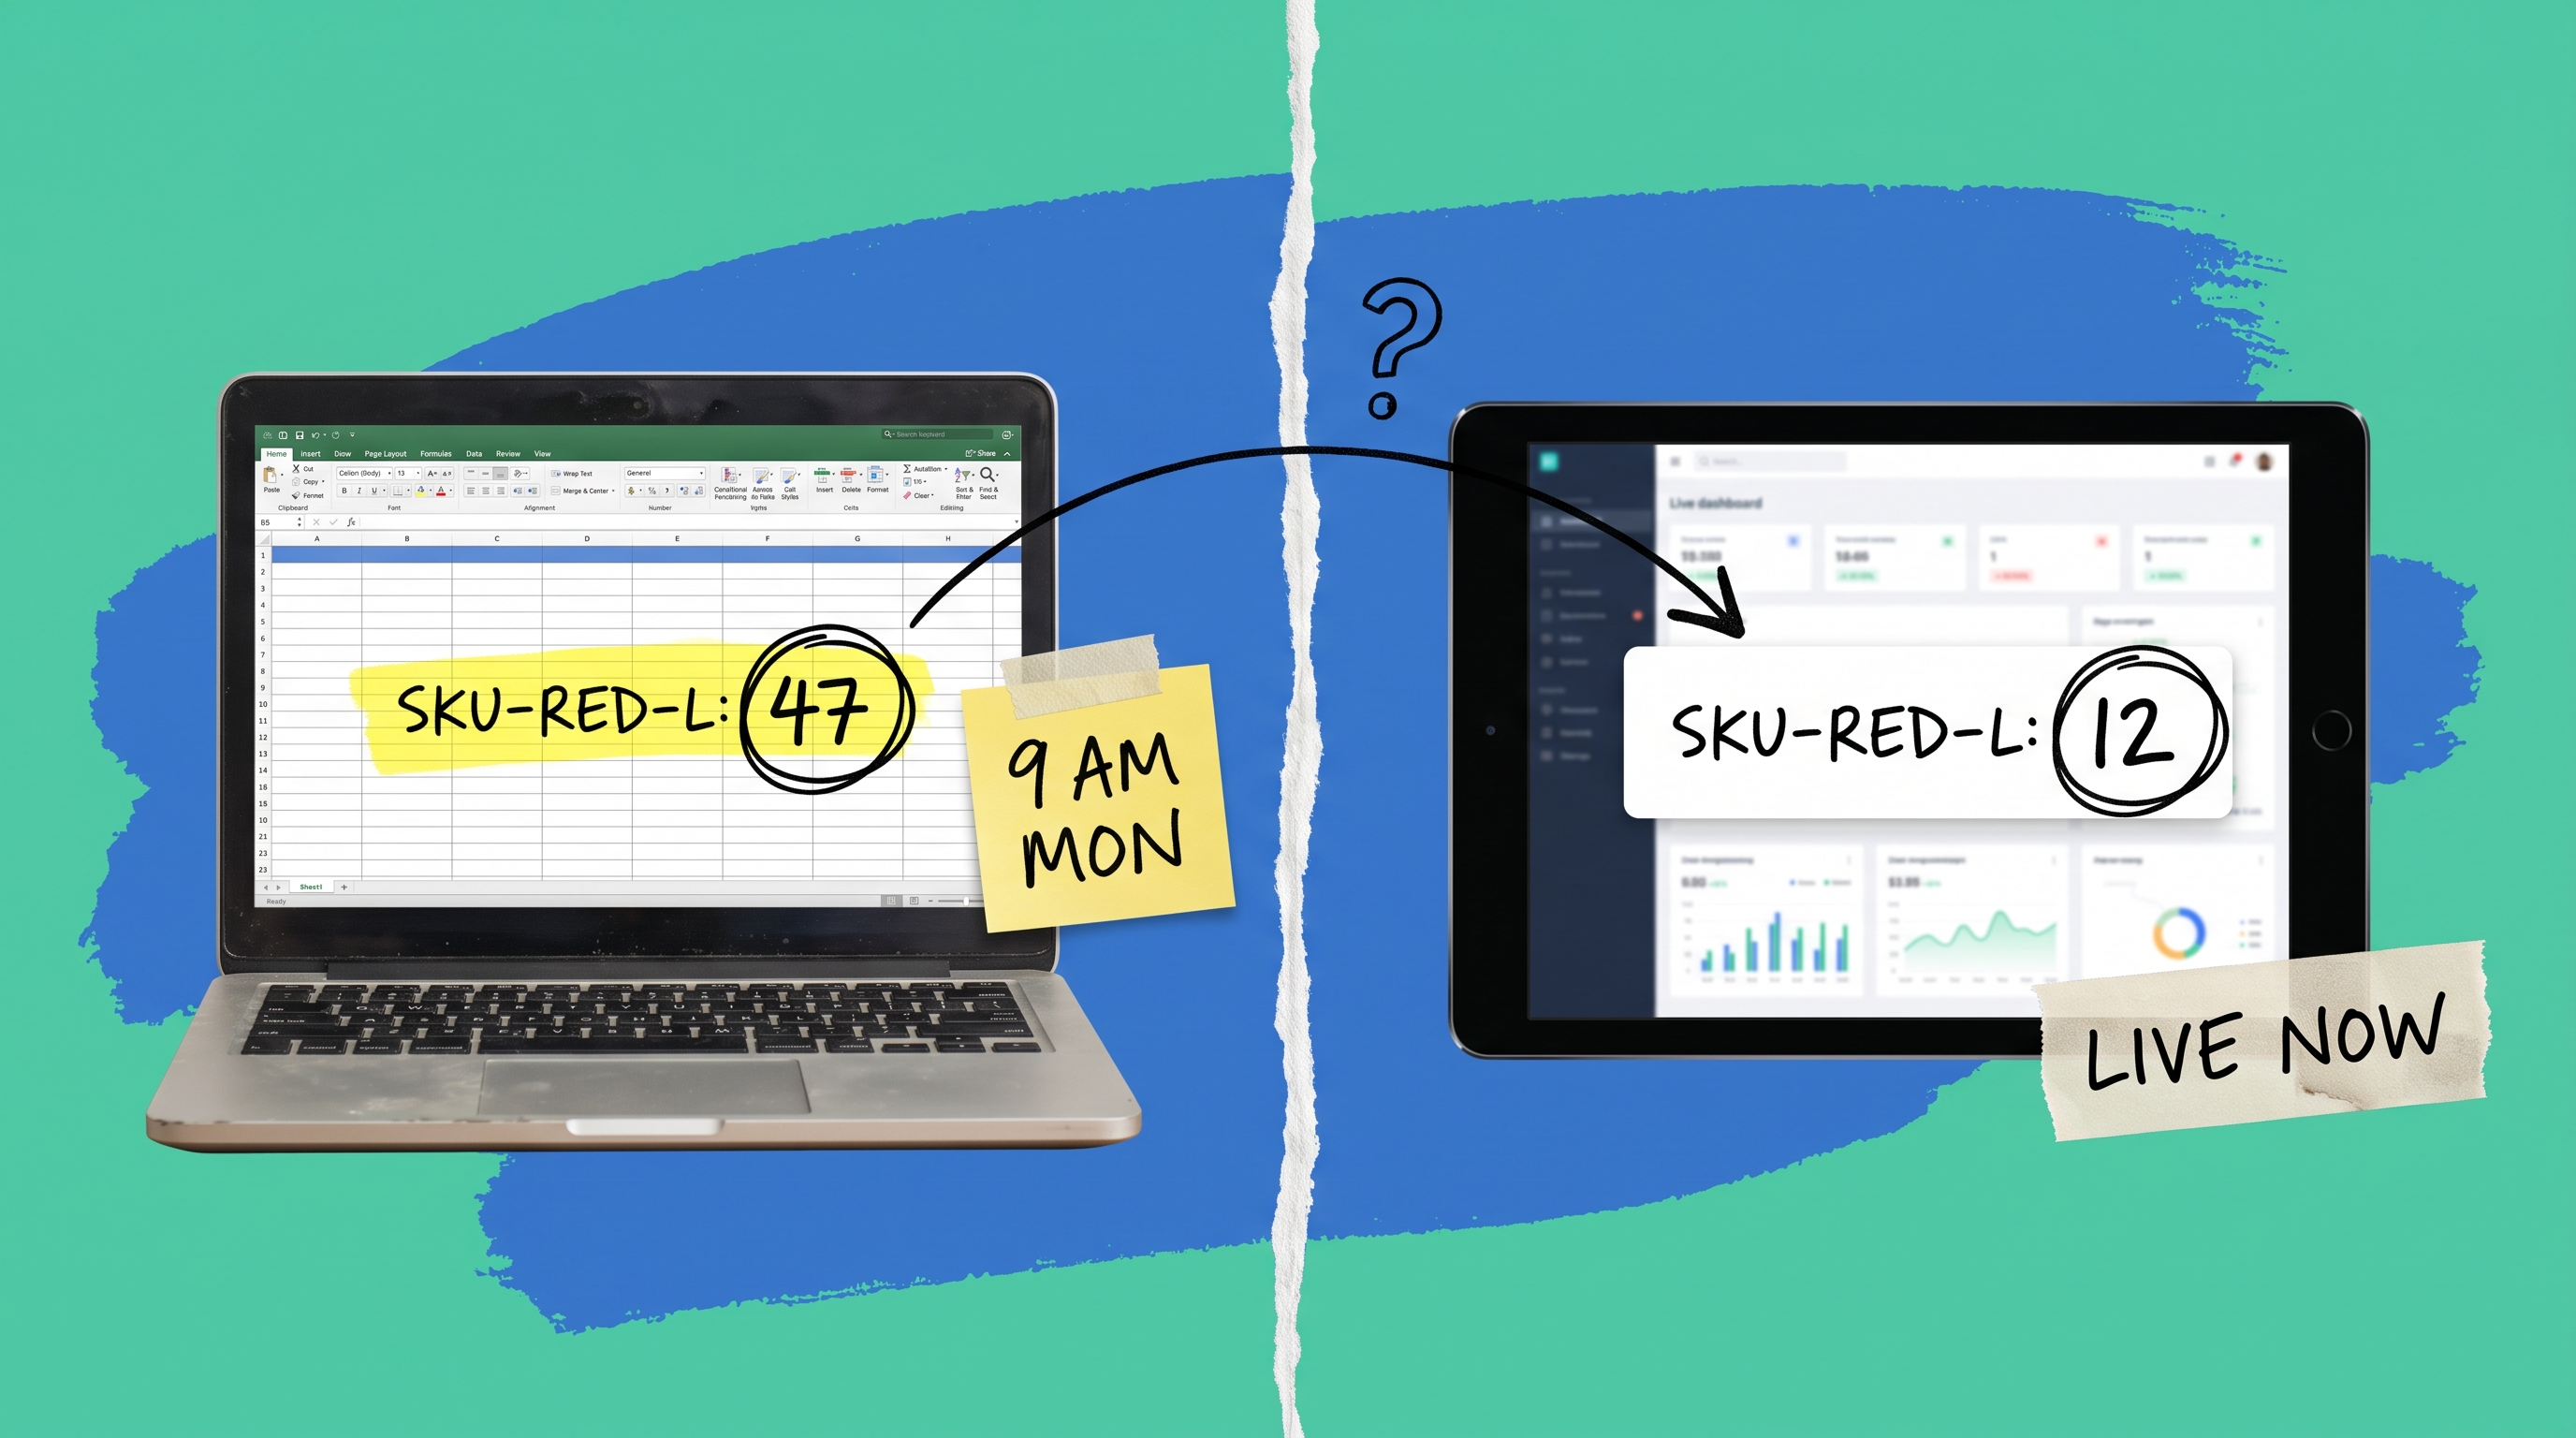
The real cost isn't the time. It's the decisions made on stale numbers. A buyer places a purchase order based on a stock count accurate at 9 AM on Monday. By Wednesday, a flash sale and a marketplace spike have consumed that buffer. The PO either overshoots or understates the actual need.
Automated inventory reports, generated directly from a connected order management system, remove that lag entirely. The numbers reflect what is happening right now, not what was happening when someone last ran an export.
How to Automate Your Inventory Reports
Automation here means two things: scheduled report generation and rule-based alerts.
Scheduled reports run on a cadence you define. A daily low-stock report, a weekly aging summary, a monthly valuation export. They arrive without anyone having to remember to pull them.
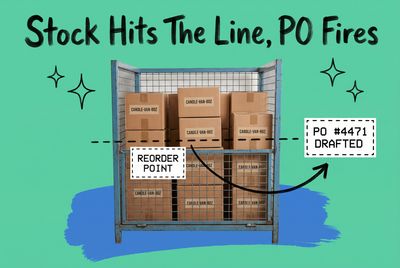
Rule-based alerts are faster. Rather than waiting for the weekly report to catch a problem, you set a threshold: if TSHIRT-BLU-M drops below 30 units at the Dallas node, trigger an alert and open a replenishment draft. OmniOrders' no-code automation engine lets you build rules like that without writing code or filing an IT request.
Both approaches require a single source of truth for inventory data. If your stock figures live in five disconnected systems, you can automate the data extraction but you cannot automate the reconciliation. A centralized platform connected to every sales channel and fulfillment location is the prerequisite, not the bonus feature.
Building Your Inventory Report Template
A solid inventory report template, whether you're building it in a spreadsheet or pulling it from your OMS, should include these columns at minimum:
- SKU identifier
- Product name and variant
- Quantity on hand (by location)
- Quantity allocated to open orders
- Quantity available (on hand minus allocated)
- Average cost per unit
- Total value (available units x average cost)
- Days since last movement
- Reorder point and reorder quantity
The "quantity available" column trips up a lot of brands. On hand and available are not the same number. If you have 200 units of SKU-RED-L but 180 are reserved for unfulfilled orders, you have 20 units available to sell. Reporting on 200 and promising that to a new sales channel creates an oversell that your 3PL then has to explain to a customer.
For multi-location operations, replicate the quantity columns for each node. A summary row at the top with aggregated totals, then per-location rows beneath, gives buyers and ops managers the view they each need without separate reports.
Stop Building Reports Manually
Your warehouse already holds the data. The reports in this guide are the structure that turns it into decisions you can act on today.
OmniOrders connects every channel, warehouse, and 3PL into one platform and generates these reports automatically. Reorder alerts, sell-through dashboards, aging summaries, multi-location snapshots: they're ready when you need them, without anyone having to remember to pull an export first.
Start your free OmniOrders trial and see your inventory data consolidated in one place from day one.
Frequently asked questions
What is inventory reporting?
Inventory reporting is the process of generating structured summaries of stock data from your inventory management system. Reports cover quantities on hand, stock value, movement history, and aging. The purpose is to give buyers, operators, and finance teams accurate, timely information for purchasing, fulfillment, and cash flow decisions.
What reports should an ecommerce business run?
The most useful inventory reports for ecommerce are: current stock snapshot, inventory valuation, low stock and reorder alerts, sell-through rate, dead stock and slow movers, inventory aging, stock movement audit, and multi-location distribution. Which reports take priority depends on your channel mix, order volume, and whether you manage your own warehouse or rely on 3PLs.
What should an inventory report template include?
A standard inventory report template should include SKU, product name, quantity on hand, quantity allocated to open orders, quantity available to sell, average unit cost, total inventory value, days since last movement, and reorder point. For multi-location brands, add per-location quantity columns alongside aggregate totals.
How do you automate inventory reports?
Automating inventory reports requires connecting all your sales channels and fulfillment locations to a single inventory management system. Once connected, you can schedule reports to generate and deliver on a set cadence and configure rule-based alerts to fire when stock crosses defined thresholds. OmniOrders handles both through a no-code automation engine that does not require IT involvement to set up or modify.
What is a stock report in ecommerce?
A stock report in ecommerce is any report showing the current state of your inventory, including what you have, where it sits, and how it's moving. The term is often used interchangeably with inventory report, though stock reports typically focus on snapshot data (quantities and locations) while inventory reports may also include financial data such as cost and total valuation.
Start your 14-day free trial
See how OmniOrders connects your sales channels, 3PLs, and carriers into one operational layer — free for 14 days, no credit card.