Inventory KPIs That Actually Matter for Ecommerce: Turnover, Sell-Through, GMROI, and More
You search "inventory KPIs" and land on an article listing 27 metrics. You bookmark it. You never use it.
That's not a coincidence. Generic lists written for everyone aren't decision-useful for anyone. When your sell-through rate drops on a seasonal SKU and you have 8 weeks of inventory left, you need the specific metric that tells you whether to run a promotion, switch channels, or cut the reorder.
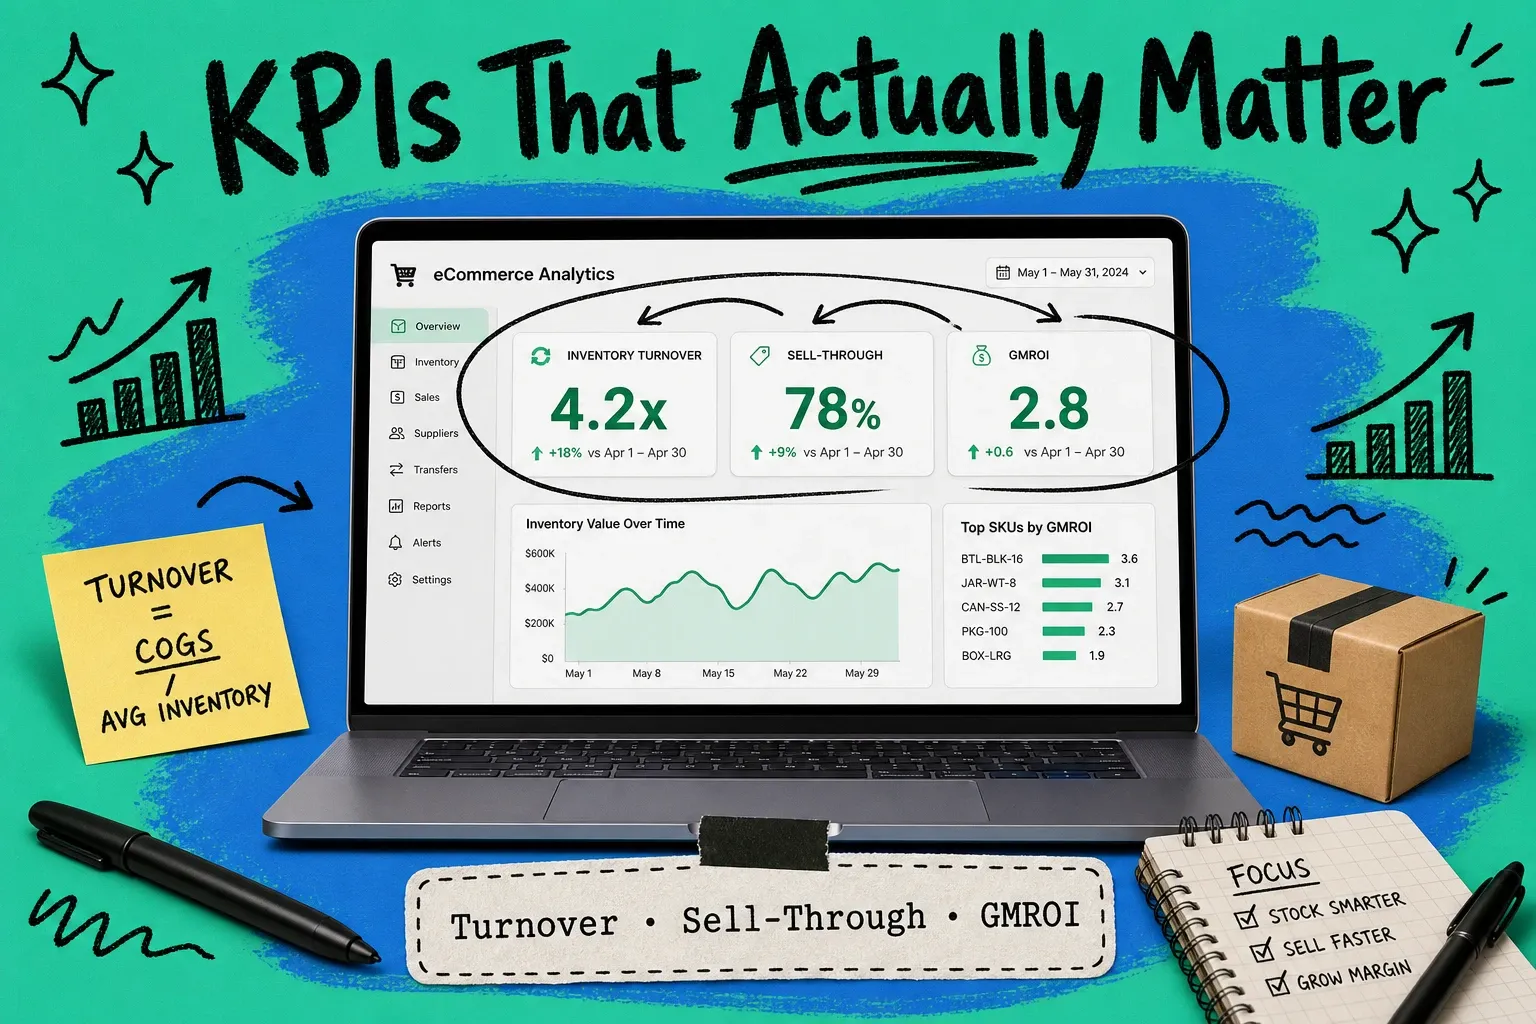
This article covers five KPIs. Not seventeen. Five metrics that change what you do next: inventory turnover, sell-through rate, GMROI, weeks of supply, and stockout rate. For each one, you'll get the formula, a worked example scaled to an ecommerce context, and the benchmarks that tell you whether your number is good or bad.
The other gap in most KPI guides: where the data comes from. If you're running multi-channel sales — Shopify plus Amazon plus wholesale — your data doesn't reconcile automatically. Your order management system is where these metrics should live, calculated in real time across every channel. A spreadsheet or quarterly ERP export gets you there eventually. An OMS gets you there now.
Inventory turnover ratio
Inventory turnover ratio: the number of times you sell through your average inventory in a given period, typically a year. High turnover means you're moving product efficiently. Low turnover means capital is sitting in unsold goods — costing you in storage fees, obsolescence risk, and missed redeployment.
Formula
Inventory Turnover = Cost of Goods Sold (COGS) ÷ Average Inventory Value Average Inventory = (Beginning Inventory + Ending Inventory) ÷ 2To express this as days rather than a ratio:
Days Inventory Outstanding (DIO) = 365 ÷ Inventory Turnover RatioIf your turnover is 6x, you're holding roughly 61 days of inventory at any given time.
Benchmarks by GMV tier and category
GMV tier | Target turnover ratio | Notes |
|---|---|---|
Under $1M/yr | 4–6x | Smaller buffers, higher demand volatility |
$1M–$10M/yr | 6–10x | Varies significantly by product category |
$10M–$50M/yr | 8–12x | Multi-channel brands often sit lower due to safety stock |
$50M+/yr | 12x+ | High-velocity SKUs with tight replenishment cycles |
By category:
- Apparel/fashion: 4–6x (seasonality means slower turns on core SKUs)
- Consumer electronics: 8–15x (high COGS, rapid obsolescence — move it fast)
- Grocery/consumables: 12–25x (short shelf life demands fast cycling)
- Furniture/home: 3–5x (high AOV, low velocity — this is normal)
Worked example
You're running a $2M/year apparel brand on Shopify and Amazon. Your COGS for the year is $900,000. Beginning inventory on January 1 was $150,000; ending inventory on December 31 came in at $130,000.
Average Inventory = ($150,000 + $130,000) ÷ 2 = $140,000 Inventory Turnover = $900,000 ÷ $140,000 = 6.4x Days Inventory Outstanding = 365 ÷ 6.4 = 57 days6.4x sits right in range for your tier and category. If this dropped to 3x, you'd start asking what's sitting unsold and why.
How to pull this from your OMS
A multi-channel OMS calculates turnover in real time across all your sales channels and warehouse locations. You're not exporting one channel's COGS and manually reconciling it against inventory counts from another platform. The OMS holds a single inventory record mapped to aggregated order data — so your turnover number is current, not a month-end snapshot.
Sell-through rate
Sell-through rate measures what percentage of your starting inventory you actually sold during a given period. Unlike turnover, which counts how many times you cycled through inventory, sell-through measures what percentage of a specific batch you moved.
It's most useful for seasonal SKUs, new product launches, and fashion — anything where you bought a fixed quantity and need to know how fast it's going.
Formula
Sell-Through Rate = (Units Sold ÷ Units Received) × 100Or for an existing batch:
Sell-Through Rate = (Units Sold ÷ Beginning Inventory) × 100Benchmarks by category
Category | Healthy sell-through | Watch level |
|---|---|---|
Apparel (seasonal) | 80%+ by end of season | Below 60% at 75% through the season |
Electronics | 90%+ within product lifecycle | Below 70% — markdown or bundle |
Home goods | 70–80% in 90 days | Below 50% — reorder signals are off |
Accessories | 85%+ in 60 days | Below 65% — evaluate channel mix |
When to reorder vs. when to markdown
If sell-through is above 80% with 30%+ of the selling window left, reorder. You're going to stock out before the season ends.
If sell-through is below 50% with less than 25% of the selling window left, markdown. The longer you wait, the deeper you'll have to cut to move it.
The 50–80% zone in the middle is where buying judgment matters. You're reading demand signals, checking whether the slowdown is channel-specific or product-wide, and deciding whether to shift marketing spend.
Worked example
You bought 500 units of a fleece pullover for Q4. By October 15, you've sold 220 units. The main selling window runs through December 31.
Sell-Through Rate (Oct 15) = (220 ÷ 500) × 100 = 44%You're 44% sold through with most of the season still ahead. At this pace, you're roughly on track — but check whether these are moving on Amazon or stalled on your DTC site. Channel-specific slowdowns sometimes mask solid overall demand.
How to pull this from your OMS
Your OMS shows sell-through by SKU and by channel side by side. If the fleece is flying on Amazon but stalled on Shopify, you know exactly where to shift spend or run a promotion — without pulling separate reports from each platform.
GMROI (Gross Margin Return on Inventory Investment)
Most generic KPI lists skip GMROI or bury it at number 22. That's a mistake. GMROI is the single best metric for evaluating whether a buying decision was actually good.
What it measures
GMROI measures how many gross margin dollars you generated for every dollar you invested in inventory. It combines two things turnover alone misses: how fast you sold it and how much margin you made.
Formula
GMROI = Gross Margin Dollars ÷ Average Inventory Cost Gross Margin Dollars = Net Sales − COGSWhy turnover alone can mislead you
Two SKUs, same turnover argument:
- SKU A turns 8x per year at 15% gross margin
- SKU B turns 4x per year at 45% gross margin
By turnover: SKU A looks better. By GMROI:
- SKU A: 8 × 0.15 = GMROI of 1.2 (you get $1.20 back for every $1 invested)
- SKU B: 4 × 0.45 = GMROI of 1.8 (you get $1.80 back for every $1 invested)
SKU B is the better inventory investment. Without GMROI, you'd likely reorder more of SKU A.
Benchmarks
GMROI | What it means |
|---|---|
Below 1.0 | You're not covering your inventory cost with the margin you're making |
1.0–2.0 | Marginal — acceptable only if it's a traffic or acquisition driver |
2.0–3.5 | Healthy for most ecommerce categories |
3.5+ | Strong performer — prioritize in buying and ad spend |
Worked example
You carry two products:
- Product X: Average inventory $10,000, gross margin earned $8,000 → GMROI = 0.8
- Product Y: Average inventory $8,000, gross margin earned $18,000 → GMROI = 2.25
Product X at 0.8 means you're not covering your investment. You either need to increase margin or reduce your inventory position — buy less, negotiate better costs, or discontinue.
Product Y at 2.25 is solid. Push it to 3.0 by shaving COGS slightly and it becomes a star SKU worth prioritizing in your next buying cycle.
How to pull this from your OMS
Margin data typically lives in your accounting system; inventory data lives in your WMS or selling platforms. An OMS that integrates both surfaces GMROI per SKU in real time. Without that integration, you're calculating this quarterly in a spreadsheet — and by the time you find the under-performers, you've already reordered them.
Weeks of supply
Weeks of supply tells you how long your current on-hand inventory will last at your current rate of sales. Think of it as the countdown timer on your inventory.
It looks forward, not backward. DIO measures what you turned over historically. Weeks of supply answers a different question: at this pace, when do we run out?
Formula
Weeks of Supply = On-Hand Inventory Units ÷ Average Weekly SalesFor fast-moving categories, weight recent weeks more heavily than a six-month average — recent velocity is more predictive.
Using it for automated reorder alerts
Set your reorder point using two inputs:
- Lead time in weeks (supplier to warehouse)
- Safety stock buffer (how many weeks you want as a cushion against spikes)
When weeks of supply drops to Lead Time + Safety Stock, reorder. No more manually checking "do we have enough?" — the metric tells you.
Example: Your lead time is 3 weeks and you keep 1.5 weeks of safety stock. Your reorder threshold is 4.5 weeks of supply.
Worked example
You sell 400 units of SKU-BOTTLE-32OZ per week on average. You have 2,000 units on hand.
Weeks of Supply = 2,000 ÷ 400 = 5 weeksWith a 3-week lead time and 1.5-week buffer, you're at the reorder threshold. Order now, not next week.
How to pull this from your OMS
Weeks of supply in an OMS is calculated against live order velocity across all channels. If your Amazon velocity spikes during a sale event, your weeks of supply drops in real time — and your reorder alert fires when it should, not when you happen to check a report.
Stockout rate
Stockout rate measures how often you're unable to fulfill orders because you've run out of inventory. The financial impact is rarely visible in your standard reports until you go looking.
A stockout on Amazon means a lost buy box position. On your DTC site, it means a lost sale — and sometimes a lost customer who goes to a competitor and doesn't come back.
Formula
Stockout Rate = (SKUs Out of Stock ÷ Total SKUs Tracked) × 100For a specific product:
Stockout Frequency = Stockout Events ÷ Total Selling Days × 100Modeling the revenue impact
If 25 of your 500 SKUs are out of stock at any given time, your stockout rate is 5%. But which 25 matters. If your top 50 revenue SKUs are all in stock, impact is minimal. If three of your top 10 are out, it's material.
Model it as: Average daily revenue per SKU × stockout duration in days × 0.70 (roughly 70% of out-of-stock periods result in lost sales rather than delayed purchases — customers move on).
The multi-channel stockout problem
On a single DTC site, a stockout is visible. In a multi-channel operation, it can be invisible. You might be sold out on Amazon while holding inventory in your warehouse that isn't allocated to the marketplace. That's a routing problem, not an inventory problem.
An OMS with real-time inventory sync across channels catches this. When your Amazon buffer runs low, the system can pull from reserve inventory and push it to the channel automatically, before you hit zero.
Worked example
Last quarter, SKU-JEANS-32-34 had 14 stockout days out of 91. Your average daily revenue on this SKU is $480 across all channels.
Stockout Frequency = 14 ÷ 91 = 15.4% of the quarter Estimated lost revenue = 14 days × $480 × 0.70 = $4,704$4,704 in one quarter on one SKU. If you have 15 SKUs with similar patterns, you're looking at more than $70,000 per quarter in lost revenue that won't show up in any report unless you calculate it yourself.
Building your KPI dashboard
You don't need all five of these on a daily basis.
Metric | Review frequency | Primary action trigger |
|---|---|---|
Weeks of supply | Daily | Reorder if below threshold |
Sell-through rate | Weekly | Markdown or shift channel spend |
Stockout rate | Weekly | Investigate channel allocation |
Inventory turnover | Monthly | Adjust buying plan |
GMROI | Monthly/quarterly | Prioritize SKUs in next buying cycle |
OMS vs. spreadsheet
Under $1M in GMV, a well-structured spreadsheet can track these metrics accurately — the problem is it's only as current as your last manual update.
Between $1M and $10M, spreadsheet maintenance becomes a part-time job and the error rate starts affecting decisions. This is typically when the ROI on an OMS becomes clear — not because of any single feature, but because of how much faster you catch problems when the data is live.
Above $10M, the question isn't whether you need an OMS. It's whether your current OMS gives you this visibility at the SKU and channel level.
Frequently asked questions
What is inventory turnover ratio?
Inventory turnover ratio measures how many times you sell through your average inventory in a given period, usually a year. Calculate it as Cost of Goods Sold divided by Average Inventory Value. A higher ratio means you're converting inventory to sales more efficiently.
What is a good inventory turnover ratio?
It depends on your category. Apparel typically sees 4–6x. Electronics 8–15x. Consumables 12–25x. If your turnover is below 4x and you're not selling furniture or high-AOV goods, start looking at what's sitting unsold and why.
How do you calculate inventory turnover ratio?
Divide Cost of Goods Sold by Average Inventory Value, where Average Inventory = (Beginning Inventory + Ending Inventory) ÷ 2. To convert to days, divide 365 by your turnover ratio.
What does inventory turnover tell you?
It tells you how efficiently you're converting inventory investment into revenue. Low turnover means capital is tied up in unsold goods. High turnover means you're moving product fast — but if it gets too high, watch that you're not regularly stocking out.
What is GMROI?
GMROI stands for Gross Margin Return on Inventory Investment. It measures how much gross margin you earn for every dollar you invest in inventory. GMROI = Gross Margin Dollars ÷ Average Inventory Cost. A GMROI above 2.0 is generally healthy; below 1.0 means your margin isn't covering what you've tied up in inventory.
How do I reduce my stockout rate?
Start by identifying which SKUs stockout most frequently and when. Then check whether the issue is forecasting (underestimating demand), allocation (inventory in the wrong channel or location), or lead time (supplier time isn't factored into your reorder point). Multi-channel sellers often find it's an allocation problem, not an inventory level problem.
Closing
These five metrics work together. Turnover tells you how fast you're cycling. GMROI tells you whether that cycling is profitable. Sell-through catches seasonal and SKU-level anomalies before they become markdown situations. Weeks of supply keeps you ahead of stockouts. Stockout rate quantifies what you're losing when weeks of supply fails.
If you're pulling these from five different reports and manually calculating them, you're spending hours every week on a backward-looking picture. An OMS with inventory reporting built in gives you this in real time, across every channel — so you spend less time calculating and more time acting on what the numbers say.
Book a 20-minute demo
See how OmniOrders connects your sales channels, 3PLs, and carriers into one operational layer.
Book a 20-minute demo