Reorder point formula for ecommerce: a guide to safety stock that actually makes sense
Search "how to calculate reorder point" and you'll find articles built for factory floor planners and ERP consultants. They give you the formula — and then illustrate it with examples about widget manufacturing and bulk raw materials.
That's not your business.
You're managing Shopify orders routed through a 3PL in New Jersey, Amazon FBA inventory sitting across multiple fulfillment centers, and maybe a Walmart feed drawing from either pool. Lead times work differently here. Holding costs land differently. And when you stock out on Amazon, you don't just miss sales — you lose ranking that took months to build.
This guide walks through the reorder point and safety stock formulas in ecommerce terms, with worked examples for both a Shopify-only brand and a split Shopify + Amazon FBA operation.
What is a reorder point?
A reorder point (ROP) is the inventory level that triggers a new purchase order. When stock on hand drops to that number, you place the replenishment order — timed so new inventory arrives before you run out.
Without a calculated ROP, you're guessing. That works fine when you have five SKUs. It breaks down fast when you're managing fifty SKUs across two channels with different lead times.
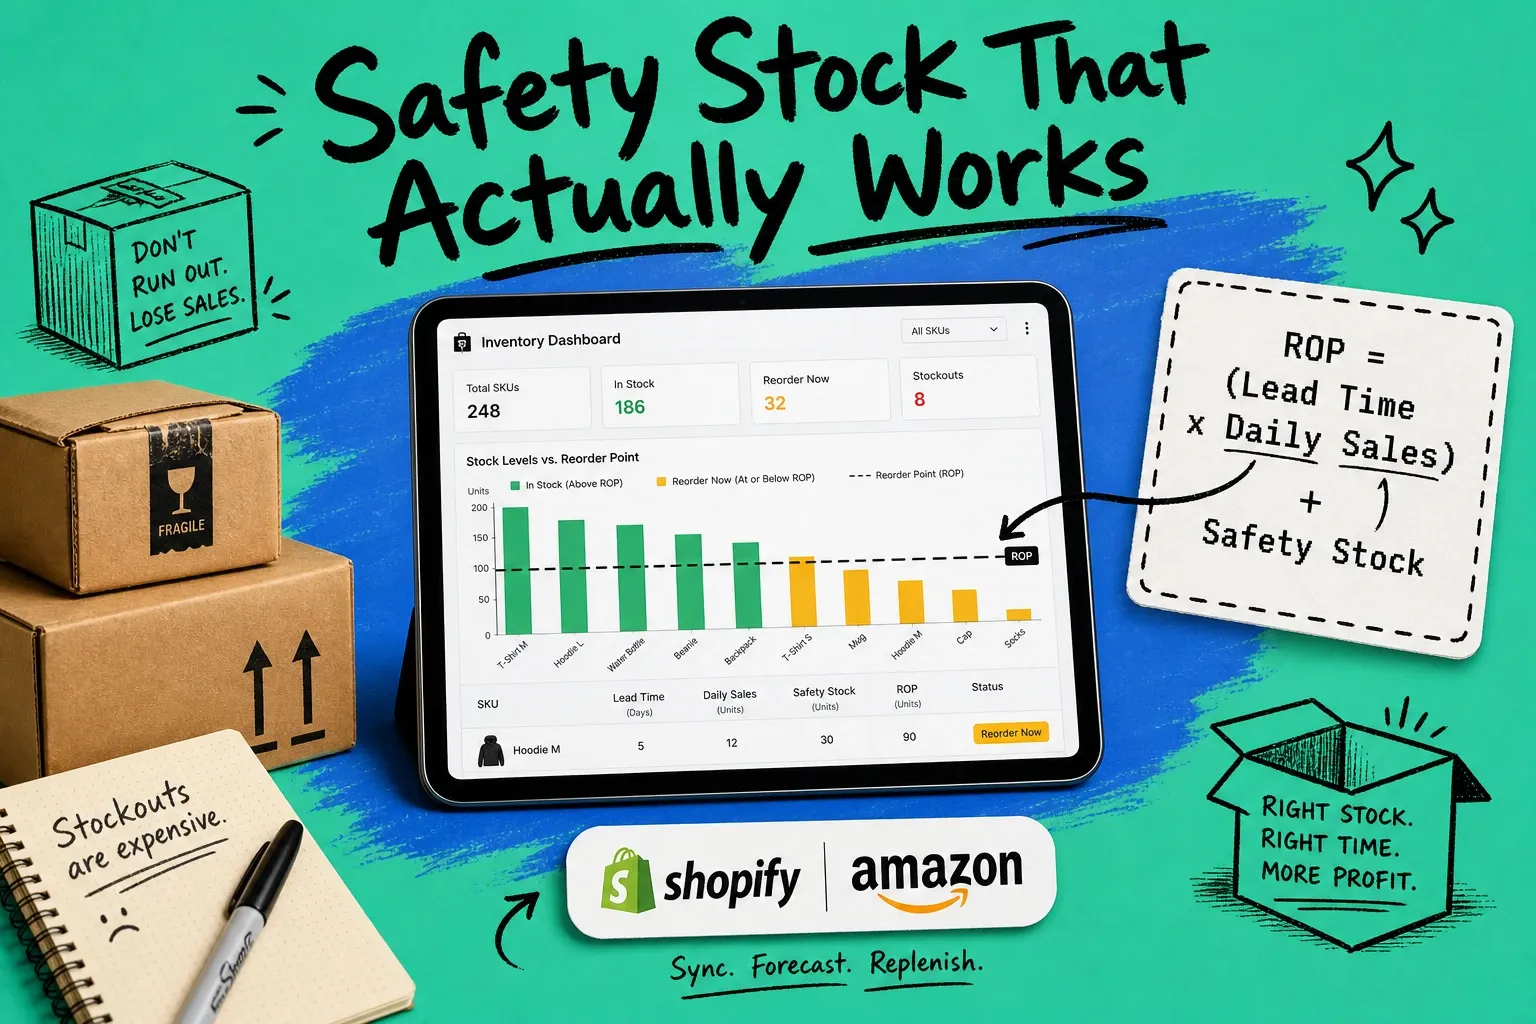
The reorder point formula
ROP = (Average Daily Sales × Lead Time) + Safety Stock
The three variables:
- Average daily sales — units sold per day, averaged over the last 30–90 days
- Lead time — days from placing the PO to having inventory ready to ship to customers (more on how this varies by channel below)
- Safety stock — a buffer for demand spikes and supplier delays, calculated separately
The formula is saying: at this inventory level, your remaining stock will last exactly as long as it takes for the new order to arrive — plus a buffer for the times when things go sideways.
How to calculate safety stock
Safety stock is the cushion that keeps you in stock when demand spikes or a supplier runs late. Two approaches, depending on how much data you have.
Basic safety stock formula
Safety Stock = (Max Daily Sales − Average Daily Sales) × Max Lead Time
Worst-case math. Assumes your hardest scenario is peak demand hitting during your longest lead time.
Example:
- Average daily sales: 15 units
- Max daily sales (last 90 days): 22 units
- Max lead time (last 6 purchase orders): 18 days
Safety Stock = (22 − 15) × 18 = 126 units
Good enough for stable, predictable SKUs. Too rough for volatile demand or long FBA inbound cycles.
Statistical safety stock formula (King's method)
The better approach for SKUs with real demand variability. It introduces a lever you control: service level — the percentage of customer orders you want to fill without stocking out.
Safety Stock = Z × σ(demand) × √(Lead Time)
Where:
- Z = the service level Z-score (table below)
- σ(demand) = standard deviation of your daily demand over your measurement window
- √(Lead Time) = square root of your average lead time in days
Service level Z-score reference
Target service level | Z-score |
|---|---|
85% | 1.04 |
90% | 1.28 |
95% | 1.65 |
97.5% | 1.96 |
99% | 2.33 |
99.5% | 2.58 |
95% (Z = 1.65) is the right starting point for most ecommerce SKUs. Use 99% for high-velocity Amazon listings where a stockout triggers ranking suppression — the recovery cost justifies the extra buffer. Drop to 85–90% for slow-moving, low-margin SKUs where carrying costs bite more than the occasional missed sale.
Example using King's method:
- Daily demand standard deviation: 6 units
- Average lead time: 14 days
- Service level: 95% → Z = 1.65
Safety Stock = 1.65 × 6 × √14 = 1.65 × 6 × 3.74 ≈ 37 units
Lead time in ecommerce: FBA and your 3PL are different problems
Most ROP guides define lead time as "time from order to delivery." Accurate but incomplete for ecommerce.
For 3PL fulfillment, the calculation is usually clean: supplier production time plus transit to your warehouse plus receiving and check-in. Often 10–20 days depending on where you're sourcing.
Amazon FBA lead time is a different beast entirely.
When you replenish FBA inventory, you're shipping to Amazon's inbound network — and that network has its own delays at every stage:
Stage | Typical duration |
|---|---|
Supplier production and packing | 10–15 days |
Ocean or air freight to US port | 14–35 days |
US customs clearance and drayage | 3–7 days |
Amazon inbound receiving | 2–10 days |
FC transfer (when Amazon splits your shipment) | 3–7 days |
Total FBA effective lead time | 32–74 days |
That 32–74 day range is your real planning window for FBA replenishment. If you're using a 14-day lead time for your Amazon ROP because that's what your supplier quotes, your reorder points are dangerously low — and you'll prove it during your next fast-sales week.
Practical approach: Pull your last 6 FBA inbound shipments. Calculate average days from PO placement to "available to sell" in your seller account. Use that as your lead time input. Use your worst recent inbound (longest actual time) as max lead time for the safety stock calculation.
Worked example 1: Shopify-only brand (3PL fulfillment)
SKU: CANDLE-VAN-12OZ (vanilla candle, 12 oz) Fulfillment: Single 3PL warehouse in Dallas, TX
Inputs:
- Average daily Shopify sales: 28 units
- Max daily sales (90-day window): 41 units
- Average 3PL lead time: 12 days
- Max lead time (last 6 orders): 16 days
Basic safety stock: (41 − 28) × 16 = 208 units
Full ROP: (28 × 12) + 208 = 336 + 208 = 544 units
When your Dallas warehouse drops to 544 units, place the next purchase order. The math assumes peak demand happens to land during your longest supplier turnaround — and you still arrive with product on shelf.
Worked example 2: Shopify + Amazon FBA (split channel inventory)
Here's where the math gets interesting and where most ecommerce spreadsheets fall apart.
SKU: PROTEIN-CHOC-2LB (chocolate protein powder, 2 lb) Channels: Shopify via 3PL in Chicago + Amazon FBA (national fulfillment network)
These are separate inventory pools with completely different lead times and very different consequences for stocking out. You need separate ROP calculations for each.
Channel A — Shopify / 3PL Chicago
- Average daily Shopify sales: 18 units
- Max daily Shopify sales: 26 units
- Average 3PL lead time: 10 days
- Max 3PL lead time: 14 days
Safety stock: (26 − 18) × 14 = 112 units ROP: (18 × 10) + 112 = 292 units
Channel B — Amazon FBA
- Average daily Amazon sales: 34 units
- Max daily Amazon sales: 55 units
- Average FBA effective lead time: 42 days
- Max FBA lead time (last 6 inbounds): 60 days
Safety stock: (55 − 34) × 60 = 1,260 units ROP: (34 × 42) + 1,260 = 1,428 + 1,260 = 2,688 units
What jumps out: the FBA reorder point is nearly 10× higher than Shopify. Amazon daily sales are about 2× Shopify — the gap comes from lead time. FBA replenishment takes 4× longer, and that multiplies through both the baseline buffer and the safety stock calculation.
If you're tracking one combined inventory number across both channels, you're running blind on at least one of them. That's where multi-channel inventory management becomes the infrastructure question, not a nice-to-have.
The holding cost vs. stockout cost tradeoff
Safety stock costs money. Every unit on your shelf ties up capital.
Annual holding cost per unit = Unit cost × Carrying rate
A reasonable carrying rate is 20–30% of unit cost per year, covering warehouse space, capital cost, shrinkage, and obsolescence risk. For a product with $15 COGS at 25% carrying rate:
- Per unit per year: $3.75
- Per unit per day: ~$0.01
- For 1,000 units of safety stock: ~$3,750/year, or $10.27/day
Real money. It belongs in your margin model. But weigh it against what a stockout actually costs you.
What a stockout costs on Amazon
Stocking out on Amazon isn't just a missed-sales event. The damage compounds:
- Listing suppression — Amazon removes the product from search when inventory hits zero
- BSR drop — Best Sellers Rank falls quickly; recovery is slow and expensive
- Ad history degradation — when Sponsored Product campaigns pause, performance data can erode
- Competitor gains — buyers who can't find you find someone else, and some of them stay there
For an ASIN doing 35 units/day at $38 average order value, two weeks out of stock is:
- Lost revenue: ~$18,900
- Relaunch ad spend to recover rank: $3,000–$10,000
- Total exposure: $22,000 or more
Against that, holding $5,000 in safety stock annually for your hero FBA SKUs is cheap insurance. The math is almost never close.
The flip side — FBA storage fees: Long-term storage fees hit hard for slow movers, especially after Q4 inventory builds. If you're applying a 99% service level to a SKU selling 2 units/day, you're probably carrying more than you need. Service level targets should scale with both velocity and what a stockout actually costs you on that channel.
When to recalculate your reorder points
ROP inputs aren't static. Recalculate when:
- Velocity shifts seasonally. A gift candle SKU selling 12/day in August might hit 80/day in December. Set your Q4 reorder points by October — not mid-November when you're already burning through buffer.
- You add or change channels. New FBA channel, new 3PL, switching from FBM to FBA — any of these changes the lead time math and the consequence calculus.
- Supplier or 3PL lead times shift. New factory, different freight lane, Amazon processing slowdowns before peak season. Update the inputs.
- You're planning a major promotion. Raise your safety stock and lower your ROP trigger before the event. You want more buffer on hand when demand spikes, not the same buffer.
- Supply chain disruptions. When lead times become unpredictable, widen your safety stock by using the statistical method with a higher Z-score until things stabilize. It's better to over-stock temporarily than to run OOS when you're already managing uncertainty.
Suggested cadence: quarterly for stable SKUs, monthly for seasonal or fast-scaling ones. With clean demand data, the recalculation itself takes 20 minutes per SKU.
What about economic order quantity?
Once you know *when* to order (your ROP), you need to know *how much* to order. That's the economic order quantity (EOQ) formula:
EOQ = √(2DS / H)
Where D = annual demand, S = cost per order (admin, shipping, setup), and H = annual holding cost per unit. It finds the order size that minimizes the combined cost of ordering too often and carrying too much.
Most ecommerce brands settle between 30 and 90 days of supply per order — enough to get container economics without sitting on too much working capital. EOQ formalizes that intuition with real numbers.
We cover EOQ in depth in a separate guide. For now, getting your reorder points right is the foundation everything else builds on.
Managing reorder points across channels doesn't have to be a manual job
Maintaining separate ROP thresholds for your 3PL pool and your FBA pool in a spreadsheet works — until you're managing 50+ SKUs across three channels and someone forgets to update the FBA lead time after your freight forwarder changes lanes.
OmniOrders tracks live inventory levels across Shopify, Amazon, and your connected fulfillment partners in one dashboard, with alerts when any channel hits its reorder threshold. If you've spent a Friday afternoon canceling oversells because you went OOS on Amazon without catching it in time, it's worth a look.
Frequently asked questions
What is the reorder point formula?
ROP = (Average Daily Sales × Lead Time) + Safety Stock. Multiply your average daily sales by your supplier lead time in days, then add your safety stock buffer. The result is the inventory level at which you place a new purchase order — timed so new stock arrives before you run out.
How do I calculate reorder point for Amazon FBA?
Start by calculating your true FBA lead time: pull your last 6 inbound shipments and average the days from PO placement to "available to sell" in your seller account. That number is often 35–60 days — much longer than your supplier's quoted lead time. Use it as your lead time input in the standard ROP formula, and use your longest recent inbound as max lead time for the safety stock calculation.
What's the difference between reorder point and safety stock?
Safety stock is the buffer portion of your inventory — extra units held to absorb demand spikes and lead time delays. It's a component of your reorder point, not a separate metric. The formula is ROP = (Avg Daily Sales × Lead Time) + Safety Stock. You can't set a meaningful ROP without first calculating safety stock.
What service level should I use for safety stock?
95% (Z-score = 1.65) is the right default for most ecommerce SKUs. Use 99% for hero Amazon ASINs where stockouts damage ranking and take months to recover from. Drop to 85–90% for slow-moving, low-margin SKUs where the annual holding cost of extra buffer exceeds the cost of the occasional stockout.
Should I use the same reorder point for all channels?
No. If you sell on Amazon FBA and fulfill Shopify orders through a 3PL, calculate separate ROPs for each inventory pool. FBA lead times are typically 3–5× longer than 3PL lead times — which means dramatically different ROP thresholds even for the same SKU.
How often should I update my reorder points?
At minimum, quarterly. Recalculate immediately when you add or remove a channel, change suppliers or 3PLs, enter a seasonal demand peak, or see a meaningful shift in your 30-day average velocity.
Book a 20-minute demo
See how OmniOrders connects your sales channels, 3PLs, and carriers into one operational layer.
Book a 20-minute demo