Inventory Planning for E-Commerce Brands: How to Forecast Demand and Avoid Dead Stock
Inventory planning is one of those things that feels fine until it isn't. You run out of your best-selling SKU the week before peak season. Or you're staring at six months of slow-moving product eating up warehouse space and working capital.
For multi-channel brands — selling across Shopify, Amazon, Walmart, and possibly your own 3PL network — the problem compounds. You're not managing one stream of demand. You're managing several, each with different lead times, different fulfillment locations, and different replenishment rhythms. A spreadsheet that worked fine at 40 SKUs starts to crack at 200.
This guide gives you the framework to do it right.
What is inventory planning?
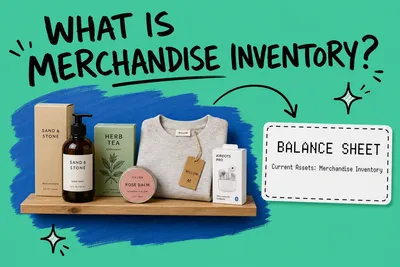
Inventory planning is the process of deciding how much stock to hold, when to reorder, and how to allocate that stock across your sales channels and fulfillment locations — so you can fill orders without tying up capital in slow-moving product.
It's not the same as inventory management, which tracks what you currently have. Planning is the forward-looking piece: deciding what you should have before orders arrive.
For a brand selling from one warehouse to one channel, this is manageable. For a brand running Shopify DTC, FBA, and Walmart Fulfillment from two 3PLs — it gets complicated fast. Each channel has its own demand curve. Each fulfillment node has its own lead time.
Get it right and you'll have fewer stockouts on your top SKUs, less capital trapped in dead inventory, cleaner fulfillment SLAs, and real confidence going into Q4 instead of the usual gut-check scramble.
Demand forecasting methods
Before you can plan inventory, you need a demand forecast. Here are the main approaches, from simplest to most sophisticated.
Historical sales average
The easiest starting point. Take your average daily sales over the last 30, 60, or 90 days and use that as your baseline.
If you sold 300 units of SKU-HOODIE-BLK over 90 days, your average daily demand is 300 ÷ 90 = 3.33 units/day.
The limitation is obvious: it doesn't account for trends or seasonality. If you're growing 20% month-over-month, last quarter's average will underestimate next quarter's demand. Use it as a starting point, not a final answer.
Moving average
A moving average smooths short-term noise by averaging demand over a rolling window. A 30-day moving average recalculates each day using the most recent 30 days of sales.
Works well for stable SKUs without strong seasonal patterns. For trending or seasonal products, you'll need seasonal adjustment.
Seasonal adjustment
If sales follow a predictable seasonal rhythm — back to school, Black Friday, Q4 gifting — you need to adjust your baseline by a seasonality factor.
The process: calculate average monthly demand over the past 2–3 years, then divide each month's demand by the annual average to get a seasonal index. December = 1.8× means December runs 80% above your baseline. Multiply your baseline forecast by that index for future periods.
If your baseline is 10 units/day and your December index is 1.8, your adjusted forecast is 18 units/day. Simple math, but it saves you from running out of stock in your best month.
AI-assisted forecasting
Modern planning tools use machine learning to incorporate multiple signals at once — historical sales, channel-specific trends, your promotional calendar, supplier lead time variability, even external factors. They catch seasonality patterns a spreadsheet would miss and recalibrate after each cycle. More on this below.
Calculating safety stock
Safety stock is the buffer inventory you hold above your baseline forecast to absorb demand spikes and supplier delays. Insurance against uncertainty.
The formula
$$\text{Safety Stock} = Z \times \sigma_d \times \sqrt{L}$$
Where:
- Z = service level factor (1.65 for 95%, 2.05 for 98%)
- σ_d = standard deviation of daily demand
- L = lead time in days
Worked example
You sell SKU-HOODIE-BLK across Shopify and Amazon.
- Average daily demand: 15 units
- Standard deviation: 4 units
- Supplier lead time: 21 days
- Target service level: 95%
Safety Stock = 1.65 × 4 × √21 = 1.65 × 4 × 4.58 = 30.2 → round up to 31 units
You hold 31 units above your forecasted need as a buffer.
One thing people get wrong: you don't need to run this for every SKU. Reserve the full calculation for your A-tier inventory. For C-tier items, a simple percentage buffer — 10–15% above forecast — is usually enough. The effort-to-accuracy tradeoff doesn't justify the full formula on a $4 keychain.
Reorder point calculation
The reorder point (ROP) is the inventory level at which you place a new purchase order, so stock arrives before you run out — accounting for both lead time and demand variability.
The formula
$$\text{ROP} = (\text{Avg daily sales} \times \text{Lead time}) + \text{Safety stock}$$
Same example continued
- Average daily sales: 15 units
- Lead time: 21 days
- Safety stock: 31 units
ROP = (15 × 21) + 31 = 315 + 31 = 346 units
When SKU-HOODIE-BLK drops to 346 units on hand, place your next PO.
For multi-channel brands, "average daily sales" should be your total demand across all channels — not channel-by-channel. What changes per channel is where the inventory lives and how fast it depletes. If your supplier ships to your East Coast 3PL in 14 days but your West Coast location in 21, each location needs its own ROP calculation. Same formula, different inputs.
ABC analysis for inventory prioritization
Not every SKU deserves the same planning attention. ABC analysis segments your catalog by revenue contribution so you can focus your capital and effort where it matters.
The three tiers
Tier | % of SKUs | % of Revenue | Planning approach |
|---|---|---|---|
A | ~20% | ~70–80% | Full safety stock + ROP, tight monitoring |
B | ~30% | ~15–20% | Simplified safety stock, periodic review |
C | ~50% | ~5–10% | Lean stock, simple % buffer, consider dropship |
How to run it
Pull 90–180 days of sales data for all SKUs, rank by total revenue (highest to lowest), and cumulate the percentages. Draw the A-tier line at ~70–80%, B at ~90–95%, remainder is C.
A real catalog might look like this:
- SKU-HOODIE-BLK: $42,000 → Tier A
- SKU-CAP-RED: $8,500 → Tier B
- SKU-KEYCHAIN-LOGO: $900 → Tier C
Tighter planning discipline belongs on your A-tier items. A stockout on SKU-HOODIE-BLK costs you in revenue, in customer trust, and in channel rankings on Amazon and Walmart — where fulfillment metrics feed directly into visibility. A stockout on a $4 keychain is annoying, not a business problem.
Your C-tier items are candidates for leaner stocking or dropship arrangements. Six months of slow-moving C-tier inventory sitting in your 3PL is one of the fastest ways to tie up working capital you need for your top sellers.
For structuring your product catalog to support this kind of analysis, our guide on SKU management for e-commerce brands walks through naming conventions, catalog architecture, and how to keep your data clean enough to run ABC reliably.
Multi-location inventory considerations
For brands fulfilling from more than one location — two owned warehouses, a mix of owned and 3PL, or a distributed network — inventory planning adds a layer that most guides skip: deciding not just how much to stock, but where.
Stock closer to where demand is concentrated. If 60% of your Shopify orders ship to the East Coast and 40% to the West Coast, your stock split should roughly reflect that. This isn't a sophisticated insight, but brands regularly underweight West Coast nodes because their primary supplier ships to an East Coast warehouse first.
Amazon FBA and Walmart WFS require stock physically inside their networks. Your DTC orders route to your 3PL. These channels can't share the same physical inventory pool unless your OMS manages routing logic that treats available inventory across locations as a unified number. Most brands learn this the hard way during Q4 when FBA stock runs out but they're sitting on 800 units at their 3PL that Amazon can't touch.
Each fulfillment location needs its own safety stock buffer. A stockout at your East Coast 3PL can't be rescued by West Coast stock if your customer expects two-day delivery. The buffer exists per node, not per SKU.
This is where order management systems earn their place. When a sale comes in on Amazon and your East Coast FBA inventory drops, your replenishment signal should fire automatically — not after a manual count on Friday afternoon. For brands routing orders across multiple locations, automated order routing lets you define rules that send each order to the optimal fulfillment location based on proximity, inventory availability, and shipping SLA.
AI-powered forecasting
The manual methods described above work for brands with a manageable SKU count and stable demand. As your catalog grows and your channels multiply, the spreadsheet approach introduces lag and error that compounds.
A machine learning forecasting model handles multiple demand signals simultaneously. A human analyst adjusts for Black Friday. The model incorporates Black Friday, channel-specific demand shifts, your marketing calendar, and SKU-level trend lines — all at once, recalibrating after each cycle based on its own forecast errors.
The other thing it does well: it flags emerging dead stock risk early. When a SKU's sell-through rate drops relative to forecast for two consecutive weeks, a well-tuned system surfaces it before it becomes a six-month problem you're trying to liquidate at 40 cents on the dollar.
What it doesn't replace: judgment on new product launches (no historical data to learn from), major supply chain disruptions, or strategic decisions about which channels to prioritize. Use AI forecasting as a signal layer. You still make the calls.
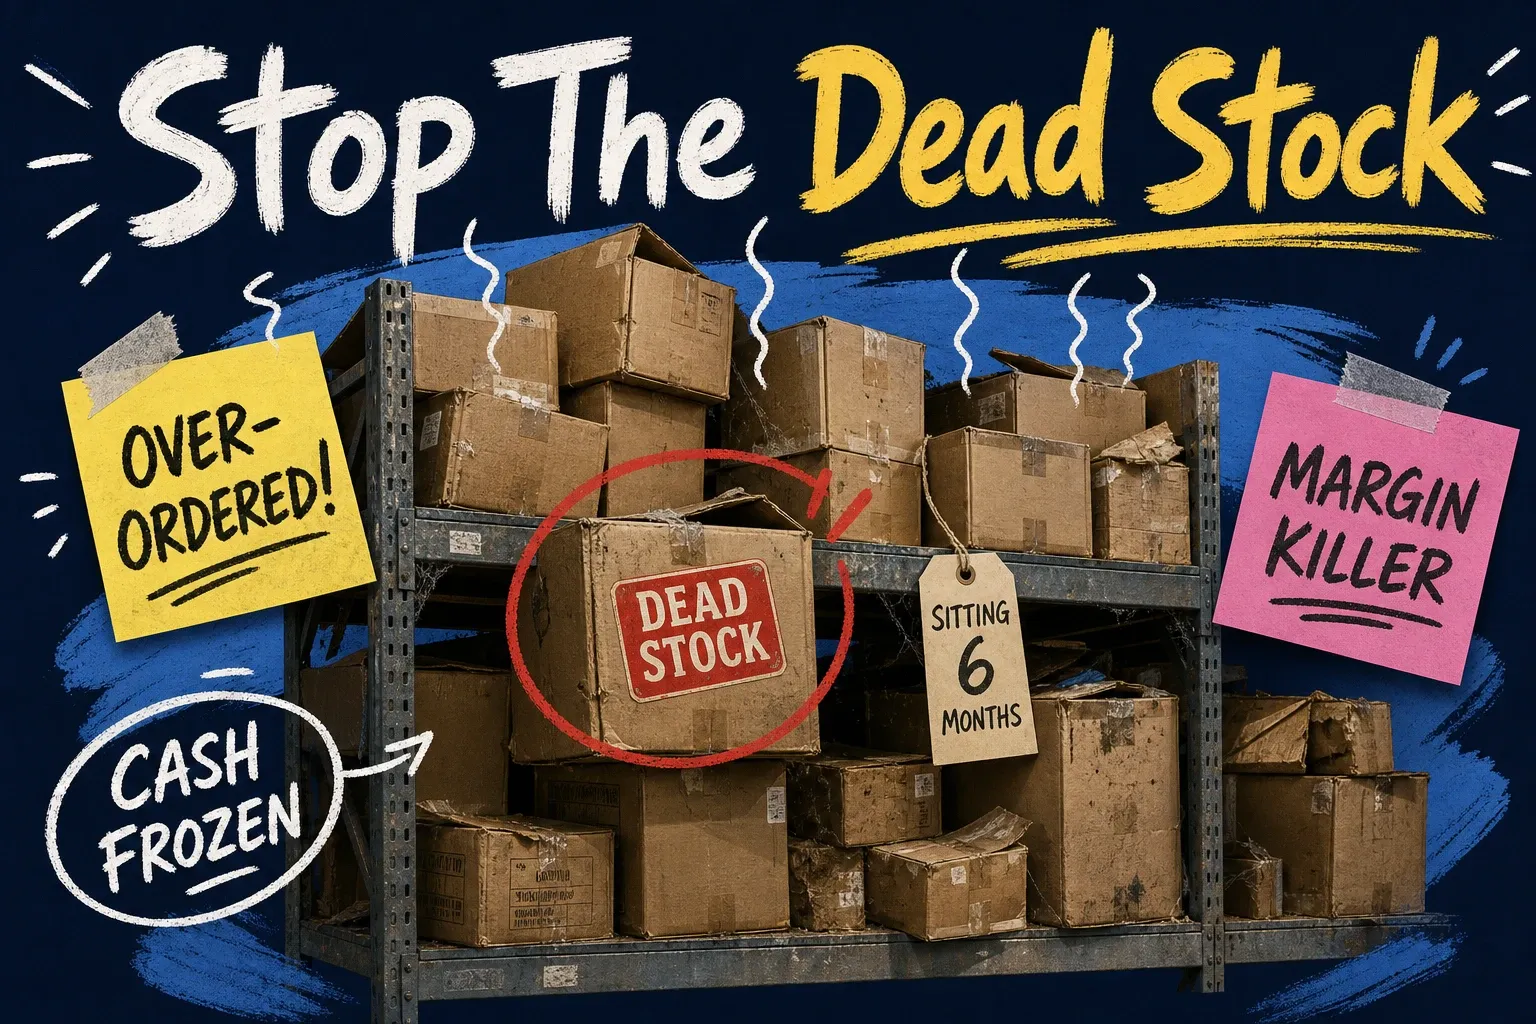
Dead stock prevention
Dead stock is inventory you can no longer sell profitably — the product is outdated, demand has collapsed, or it's been sitting long enough that holding costs exceed its remaining value.
Signs to watch for
Sell-through rate on a SKU drops below 30% of forecast for two consecutive weeks. A new product launch cannibalizes an existing one and the old SKU stagnates. You're carrying 90+ days of supply on a non-seasonal item. Amazon reduces your FBA storage allocation on that ASIN due to low performance.
What to do about it
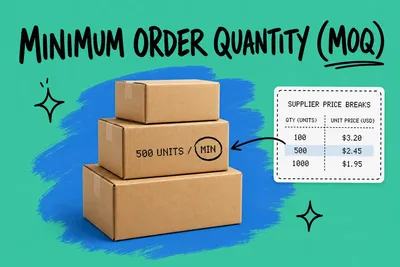
Tighten reorder quantities on C-tier SKUs. Order smaller quantities more frequently rather than bulking up for a price break — the price break rarely offsets the holding cost when things slow down.
Use promotions before the overhang compounds. A 20% markdown this week is cheaper than six months of storage fees plus a 50% liquidation price later. The math is not close.
Set inventory age alerts. Any unit sitting for 60+ days without movement gets a review. At 90 days, it gets action — a markdown schedule, a channel rotation test, or an exit plan.
Sometimes a SKU that stagnates on Shopify moves fine through Amazon or B2B channels. Before writing off slow inventory, test it across your other channels. You might be sitting on demand you haven't found yet.
Every SKU should have a planned end-of-life protocol built into your product lifecycle from the start. Most brands don't build this until they're already stuck with a pallet of something nobody wants.
Choosing an inventory planning tool
Spreadsheets work until they don't. The inflection point is usually somewhere around 50–200 active SKUs or the addition of a second fulfillment location. Beyond that, manual planning introduces enough lag and error that a purpose-built tool pays back quickly.
The tools worth evaluating aggregate demand across all channels into one view — no manual reconciliation of exports from three platforms. They automate reorder triggers: when inventory hits your ROP, you get a flag or an auto-generated PO rather than discovering the shortage after you've already sold out.
If you have multiple fulfillment nodes, location-level visibility is non-negotiable. A single total pool number is useless when you need to know which node is running low. And the tighter your planning system integrates with your OMS, the less you do manually — allocation decisions happen in real time as orders route to fulfillment locations.
OmniOrders connects inventory data across Shopify, Amazon, Walmart, and your 3PLs, giving you a single view of stock by location and channel through multi-channel inventory management. Reorder calculations are based on actual available inventory, not a snapshot from yesterday's export.
Frequently asked questions
What's the difference between inventory planning and inventory management? Inventory management tracks what you currently have — quantities, locations, movements. Inventory planning is forward-looking: deciding how much to order and when, based on demand forecasts and lead times. One is a scoreboard; the other is the game plan.
How often should I recalculate safety stock and reorder points? For A-tier SKUs, monthly or after any major change to lead time, sales velocity, or service level targets. For B and C tiers, quarterly is usually enough unless something changes significantly.
What service level should I target? Most e-commerce brands target 95–98% for their top SKUs. At 95% (Z=1.65), you'll face stockouts roughly 5% of the time due to demand variability alone. For your highest-revenue SKUs, 98% (Z=2.05) is worth the extra buffer cost. The gap in safety stock units isn't as large as the gap in stockout risk.
How do I plan inventory for a new product with no sales history? Use category-level or comparable SKU benchmarks as your initial estimate, then adjust aggressively in the first 60–90 days as actual velocity becomes clear. Start with a conservative position and prioritize fast reorder capability over a large initial buy.
How do I manage inventory planning across Amazon FBA and my own 3PL? Treat them as separate pools with separate safety stock and ROP calculations. Each has its own demand rate and its own lead time. The thing that breaks most multi-location setups is a tool that only shows one total number — you need per-location visibility to make useful replenishment decisions.
When does a product become dead stock? Watch sell-through rate relative to forecast week-over-week. Three consecutive weeks at 30% or less of projected velocity — with no obvious cause like a stockout or a listing issue — is a dead stock signal. Act at 60 days. By 180 days your options are significantly worse.
For brands building out multi-channel fulfillment infrastructure, OmniOrders handles real-time inventory sync across Shopify, Amazon, Walmart, and your 3PLs. [See how it works](https://omniorders.com).
Book a 20-minute demo
See how OmniOrders connects your sales channels, 3PLs, and carriers into one operational layer.
Book a 20-minute demo